Insert a Sales Map
![]()
Insert Sale Map
|
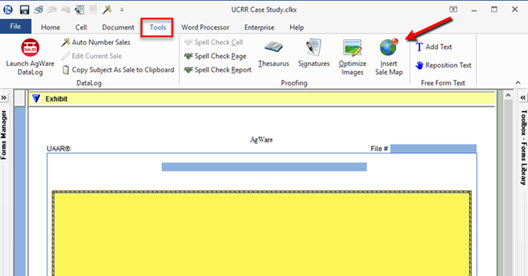
On a General Exhibit page, make sure the main cell is active (indicated by yellow high-light). Navigate to the tools tab and select Insert Sale Map. |
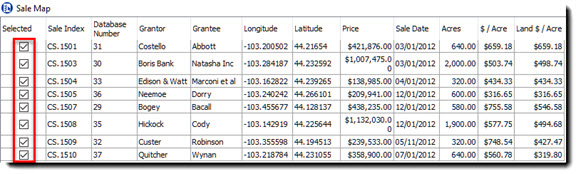
On the left, you will see a list of all sales that have a latitude and longitude. You |
|
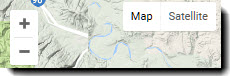
You can move the markers if needed There are standard Google Map tools (Zoom, Map and Satellite view.) |
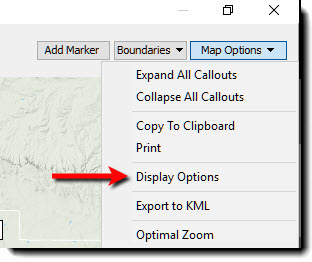
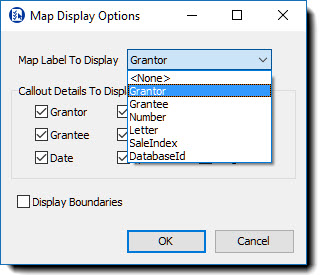
To Change the labels, click on Map Options and select Display Options then select the preferred label from the drop-down list. |
|
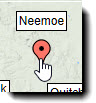
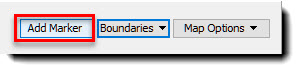
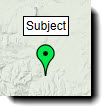
To add a marker to the map, click on Add Marker. Place the hand icon where you want the marker and Click.
|
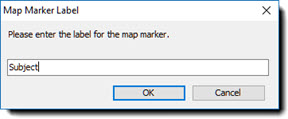
Enter the name you want and click OK. The added marker will be green to differentiate from sales. |
|
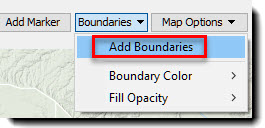
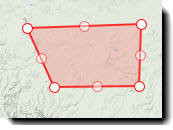
To add boundaries, click on Boundaries then click add boundaries. Click on at least 3 points to create boundary. |
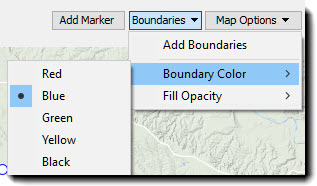
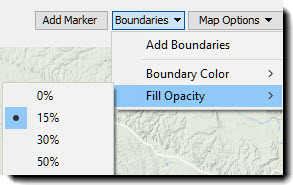
To change boundary color, click on the Boundaries drop-down and go to Boundary Color and select color. You can also change the opacity by clicking on Boundaries drop-down go to Opacity and select the desired opacity.
|