7 Steps to Complete an UAAR Appraisal
![]()
- Create a "Folder" in DataLog
- Create and Edit a Sale
- Create a "Land List" to allocated mixed sales
- Identify "Land Ratios" to allocate prices to each land category for consistent analysis
- For Improved sales, use the "Building Residual" procedures; then, allocate portions of that residual to each building based on "utility" and "condition
- Identify "income method" used (cash, share, or owner/operator) --- usually cash rentals/leases
- Identify rental amount in accordance with the unitary whole
- Identify expenses applicable for each income method applied
- Craft several Report Templates (all can be modifiable over time). "Several" means alternatives to match property type and/or complexity. Then, select the appropriate "Report Template" for each assignment
- Alternative: "Clone" a report ("Save As" function) after the user has satisfactory content. There are "cautions" when cloning --- just like cloning in an other application
- Subject QuickStart Page: Suggested all subject information entered on that initial page first (which the automatically flows to all applicable parts of the appraisal).
- Import Sales into Report
- Transfer Sales into Approach Pages
- Finalize Report
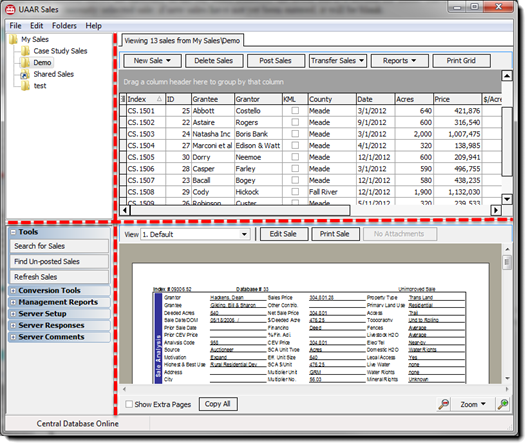
1. Start With a Folder in DataLog
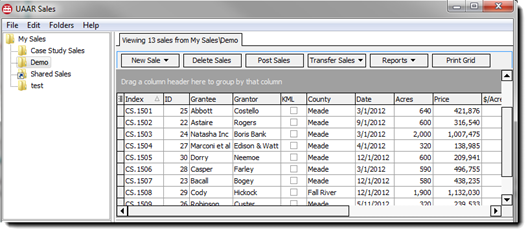
Open DataLog and observe there are four sections in the first image below. The upper left section shows the directory of the "My Sales" folder(s); the lower left is for "Tools". The upper right is the list of the sales in the folder (can be customized by clicking on the very small, multiple ‘bars’ box left of “Index”); or additional folders added. The lower right is "individual sale" viewer window, displaying the current sale selected. If new sales have not yet been entered — this portion of the window will be blank.
It is important to decide how to organize the sales folders. All users must keep the root folder named My Sales. Users may create sub-folders (counties, property type, etc.) or other "creative" ways to identify records ---- this is not necessary given the sorting ability within DataLog. In fact, it becomes very confusing over time. Sub-folders for new or shared sales (identified by sender's name) is a very good idea. New or shared sales should be reviewed for land-mix synchronization, variable fields and corresponding responses, income method(s) applied, etc.
Create and name a folder if desired by right-clicking (R-Click) on the My Sales Folder or by clicking the Folders button on the menu bar at the top of the screen. Add new folders as desired.
2. Create & Edit a Sale
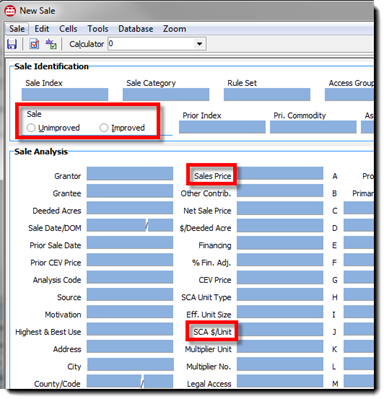
To create a new sale, click on the folder where the sale will be stored. In the sales grid, choose New Sale→New Blank Sale.
In the Sale Analysis area of the new sale check Improved/Unimproved as appropriate. Tab through the cells to enter sale data such as grantor, grantee, acres, price, etc. When you enter data into certain cells such as Sales Price, you will see other cells populate automatically, i.e. CEV Price. Be sure to enter the SCA (Sales Comparison Analysis) Unit Type and Effective Unit Size. Acres and Total deeded acres are most common, however, in cases where sales are not driven by acres, other units of measure such as AUMs, board feet, barrels, etc., should be applied. For most cells, a drop-down menu of responses can be created, then R-Click, select, and its entered.
|
|
Note: When “mousing” over certain cells a padlock icon is seen. This indicates that the cell is “locked” by the software so that automatic calculations occur. To manually change a value for a locked cell, simply click the padlock to open it and make the change. The font color will be red as a reminder that the cell is unlocked and a value was entered manually. The red font does not show on printed sales or reports. Click again to restore the default value. |
Complete the Land Mix Analysis next (below). The land table ensures consistency that is important to the Sale Comparison Approach pages in ClickForms.
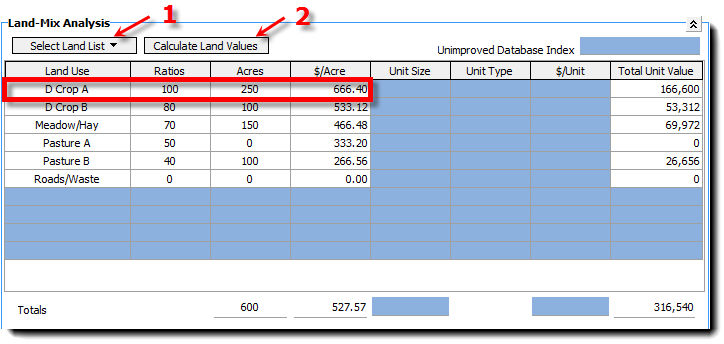
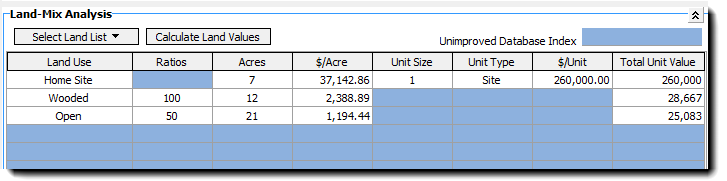
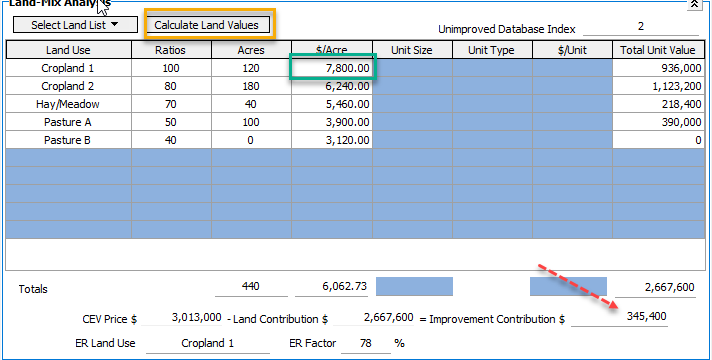
To create a land table, enter the desired land uses and their corresponding ratios into the Land-Mix Analysis grid like that shown above. The first land row MUST include a ratio of 100 in order for the software to work properly because it is the "standard" for the analysis. Remaining rows’ ratios are entered in accordance with their value relevant to the "standard" or "top-land" row.
The $/Acre value for the first land row for an IMPROVED sale is determined by the appraiser and must be entered prior to calculation of the remaining land values. See notes A and B below for explanation.
Click Select List→Add (see #1 above) and enter a name for the list if the list is to be saved for future use.Saved Lists are integrated with ClickForms! Once the land list is completed, click the Calculate Land Values Button (see #2 in image above) to compute the Total Unit Values and the remaining values in the Land-Mix Analysis section.
It is important to note that for those rural residential sales that will be used specifically in the UCRR report format in ClickForms, the site must be listed in the first row as seen below, so that when the sale is transferred into ClickForms the UCRR forms will work correctly. This means that the first true land row with a 100% ratio is the second row of the grid!
Ratios are developed by the appraiser. They represent the relative prices found in the market from:
- sales of "puritans" (sales with only one land type),
- income (typically cash rental), or
- productivity.
Productivity is a little harder when "pasture" is the market area standard because the "crop or hay" categories must be converted to a "forage equivalent" to compare with the "grazable" forage from the 100% Pasture A category shown below. Ag-Ware's "Classic" Forms Library includes a "ratio worksheet" that allows the user to reconcile their ratios from those three categories.
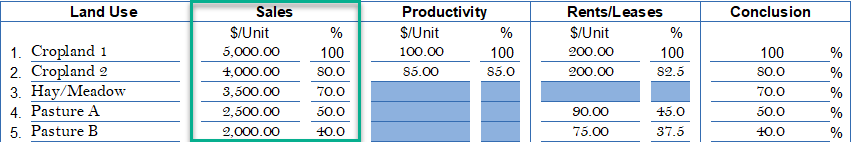
Inferior land types do not have to be arranged from the most to least valuable. AgWare recommends finding the "market standard", i.e., which land type is prevalent in the competitive market. Most weight given to the indications from sales outlined in green. Productivity and Rentals/Leases generally support because some indications were not found in this market. Reconciled results at the end of the process are shown under the "Conclusion" heading (right column). It is noted, some markets show “non-rounded” relationships and those most prevalent should be applied (without rounding to the nearest 5%). Again, AgWare suggests rounding to the nearest 1%, not 5%.
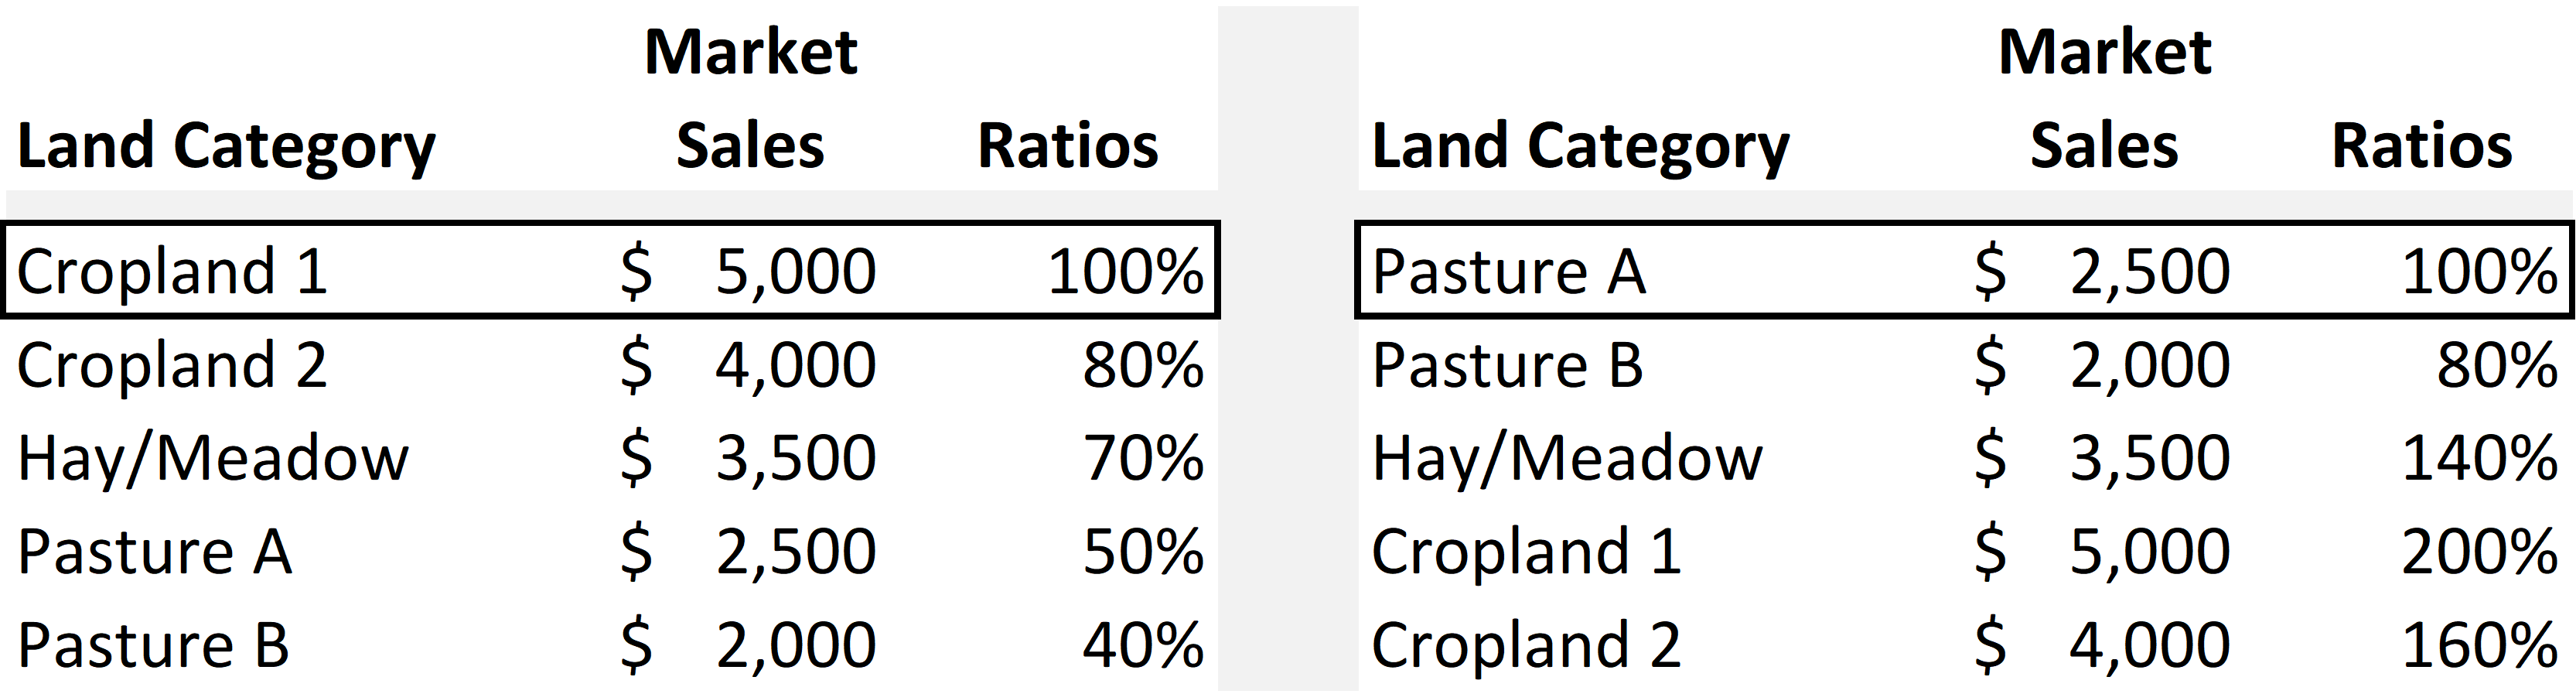
For western ranches, the "standard" and most common land type may be "Pasture A". All remaining land types are then expressed with ratios based on Pasture A or that 100% land row (as shown below right).
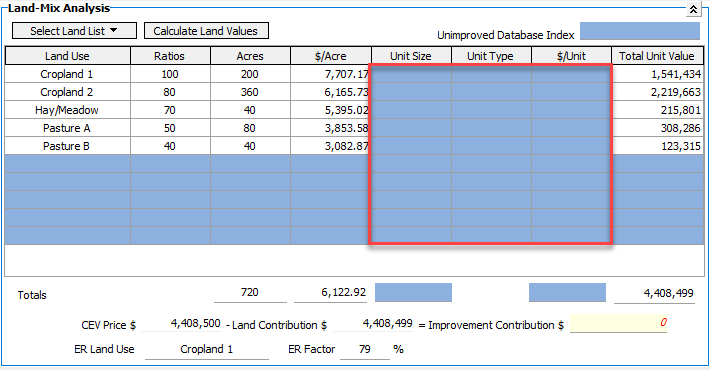
The Land-Mix Grid is split, the left side is for Acres as shown, Ratios applied to allocate prices to the $/Acre. The “Unit” columns (red box below) are for use as a "Homesite" (gross dollars per site) or with non-deeded land that may be attached to the sale, or AUMs, or permits, etc. Do NOT enter deeded acres a second time in these columns (red box below). It should be noted, any entries in the red box are the “first call” within the total price. Generally, the “red box” or "units" can also be for or other uses, i.e., price per barrel, price per ton, price per mbf, etc.
ASFMRA, AgWare, and DataLog subtracts the land value from the CEV price, leaving a residual for improvements, or the "building residual". In some markets, there may be no improvement contribution even through new or very functional structures exist. Note: just because structures physically exist does not mean they contribution to value in all cases. What do the sales say? Users frequently, say how can they NOT have value? It is simple to measure. If two highly similar sales occur in the same market, one is improved and one is not but they sold for the same price per acre, the improved on the second sale do not contribute to value. Buyer verifications will also confirm and/or add credence to that scenario. It may be an anomaly or a market reality at that point in time. Analysis of several improved versus unimproved sales should provide direction.
How does DataLog work?
- UNIMPROVED SALE: Input the number of acres for each of the land types; then click Calculate Land Values. The $/Acre and Total Unit Value columns fill with data. The final $/Acre reflects the land/mix ratios for the list used. A price per acre ("$/Acre") contribution for each of the land types is needed, even though the sale may not include all land types. This is important because the subject may have land types that the sale does not. The land/mix ratios should be reviewed and adjusted periodically to match market conditions. Using land lists ensures consistent data entry, and critical for the software calculations to work properly.
- IMPROVED SALE: Enter the desired $/Acre for the first land mix row (green box). This value should be approximated from unimproved sales (a "puritan" if necessary). Next, click "Calculate Land Values" (yellow box), the land portion is allocated from ratios and the building residual computed (red arrow). It is important to remember that the residual contribution goes to the improvement/s, not to the land.
Sale Improvement Analysis
Once the improvement contribution is quantified, splitting that amount among each building is next. For some property types the market may view buildings in a cumulative sense, i.e., percent contribution versus the total sale price. However, as building contributions accelerate to a point where they become a major part of the total sale price, allocation to each building and analysis of age, condition, utility, etc., becomes necessary.
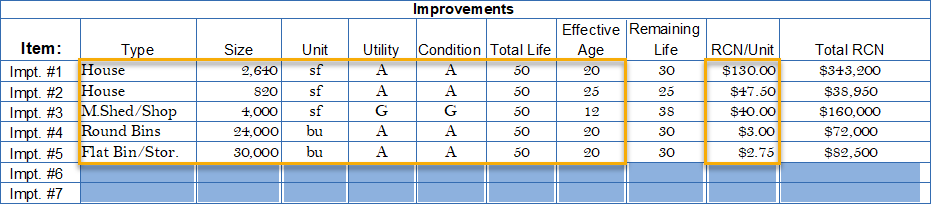
DataLog and ClickForms Grids allow for up to twenty improvements per sale or subject. If the user/analyst has more than 20 structures, attempt to group those of similar type and/or utility and condition. Input the information in the tab order (top to bottom), for as you move from cell to cell, the values for age and remaining life will calculate and update automatically. For example as below left, enter data for a house with 2,640 sf in average utility and good condition. With Total Life of 50 years, RCN/Unit of $130 and Physical Depreciation of 40% entered, the software will calculate the remaining life at 30 years.
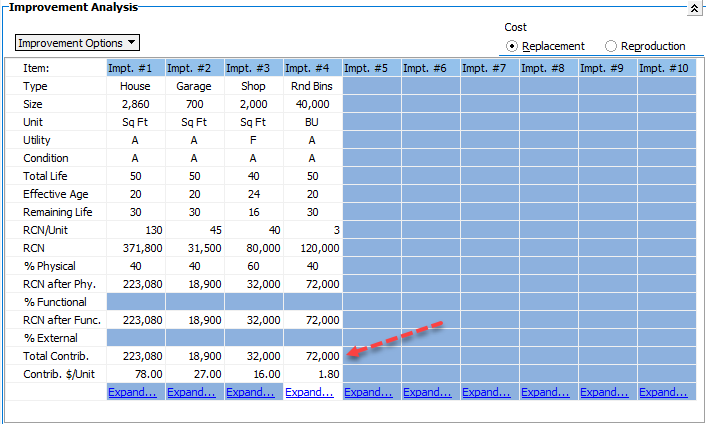
The process is simple with just one building. For multiple structures, the price “allocation” is manually entered, and may be "re-adjusted" several times to "balance" the mathematics versus what exists. Some buildings within a larger set of structures may not have value. This should be considered with multiple buildings of the same type or utility. The appraiser moves through the process, they must decide how the depreciation is to be allocated between the improvements addressing the degree of physical, functional, or external obsolescence. See a AgWare video about Depreciation Options.
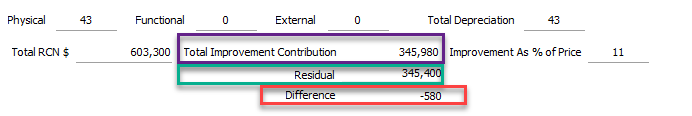
The purple box is the sum of the total contribution of the four buildings at the line shown by the red "dashed" arrow. The goal is to match, as near as reasonably possible, the land residual (green box) at the appraiser’s discretion. When that process produces something less than, say $1,000, plus or minus, the distribution should reflect the appraiser's interpretation of the best allocation. That judgment may change over time as new sales become available, but it merely reflects a reasonable degree of price allocation to each structure.
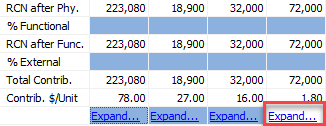
There is an optional link at the bottom of each improvement to create an expanded Improvement Detail analysis page (red box below). This option is recommended for specialized improvements or where more information is required. Choose the type: Generic or House. For House, the house-specific data points will transfer into the UCRR Sales Comparison Approach page in ClickFORMS or any other ClickForms container. Improvement Detail pages DO transfer into a report by individual improvement as part of the total sale documentation.

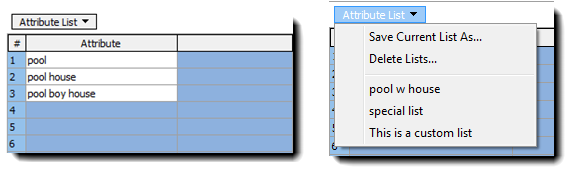
An Attribute List is created in the same manner as a Land List. When the expanded improvement page is chosen, the Attribute List is empty. Enter the attributes for the improvement in the appropriate cells. To save the list for future use, click the drop-down arrow and choose Add — then name the list. The point is to sync all potential subject’s and improvement lists for this property type so that one “macro-list” covers all attributes for each specific group.
The Photo Pages allow the user to embed jpeg images and PDF exhibits in the sale. This means that Photo Pages move with a sale when it is transferred into a report. The Comments and Attachments Sections are located at the bottom of the sale sheet. There are four tabbed pages for a variety of comments options. The first three tabs are for comments that the appraiser wants to include not only in the sale file, but on the corresponding pages in a future report. For example, comments included on the Sale Sheet tab will migrate onto the actual Sale Sheet page of a report in ClickForms when the sale is pulled into a report. Comments entered on the General tab stay with the sale. If the appropriate forms are included in the ClickForms report, the Sales Comparison and Cost Approach comments pages will transfer to them. Attachments do not automatically migrate into a report because they are not embedded into a sale. They are merely contained within the attachment window for the user’s convenient access.
Caution: Two numbers can identify sales in DataLog. When a new sale is saved the software automatically assigns a specific Database (D or ID) number to the sale (1, 2, 3…). This number is not meant to be used as an appraiser’s reference because it is not permanent. There is a cell in the extreme upper left portion for an Index (I) Number of the sales sheet. This is for a user-preferred internal numbering system that a standard license user can create. * Many users opt for something like “2014-M13-001”, where the year is first, the “M13” is a county code and “001” identifies this as the first sale written for the year 2014 in that county. Some merely assign the “next consecutive” number with a corresponding separate file folder that contains all documents, pictures, etc., that are collected for that sale. Some users may also attached that incremental pieces to the “attachments” portion of each DataLog Sale file. There is a multitude of possibilities how to store, attach and/or manipulate the data.
The software never changes i-numbers. The “i” number must ALWAYS be unique for each sale and is assigned manually by the standard license user. It can be a mix of letters and numbers. NOTE: Enterprise licensees use the “Get Index” option in DataLog to assign a specific “i” number due to multiple users accessing the same database.
The DataLog default process saves changes to the sale automatically upon exiting/closing the sale. A message appears on screen as a reminder that changes are being saved. To exit a sale without saving any changes, choose Sale→Close Sale without Saving.
See the section on Mapping.
NOTE: REPEAT STEPS 1-2 FOR EACH SALE YOU ARE USING IN THE APPRAISAL.
NOTE: This tutorial document addresses the process for creation of a basic agricultural appraisal report. For information on special formats like UCRR, unique considerations such as permanent plantings, etc., please use the search tool at the top of the User Manual window, or click on hyper-links found throughout this tutorial as well as the remainder of the User Manual.
Sale Income Analysis
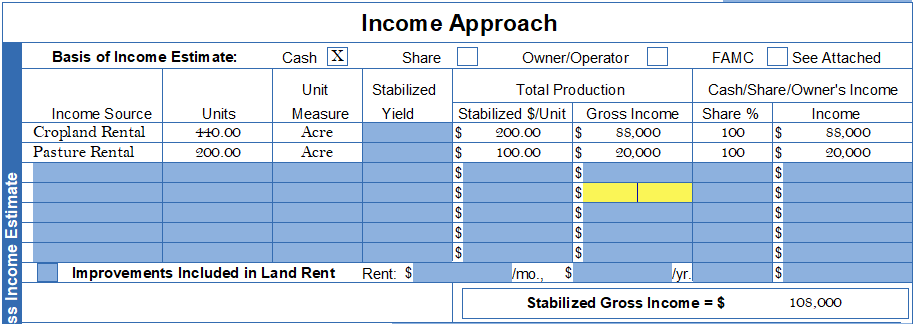
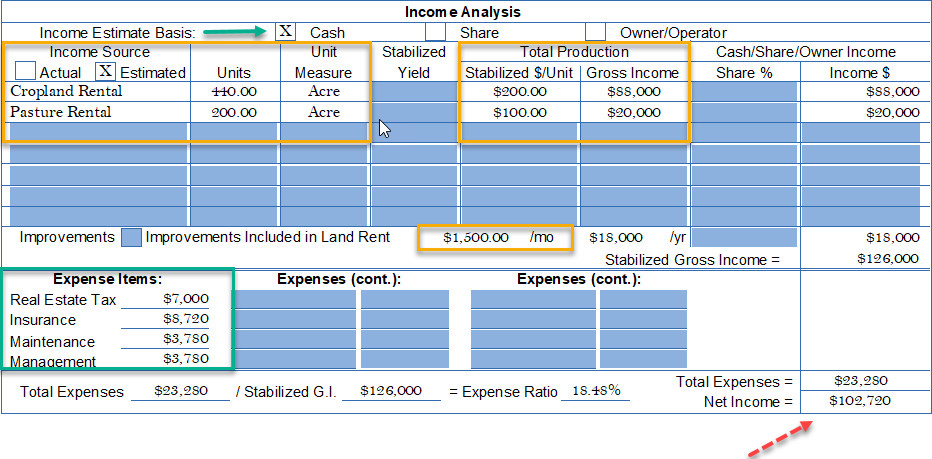
A Cash Rent is used in this example (yellow box). Cropland rent is $200/acre and Pasture rent $100/acre (red box). The “Cash” income portion must sync with the income basis of calculation. The Stabilized Gross Income (cash basis) is totaled at $108,000 by the program.
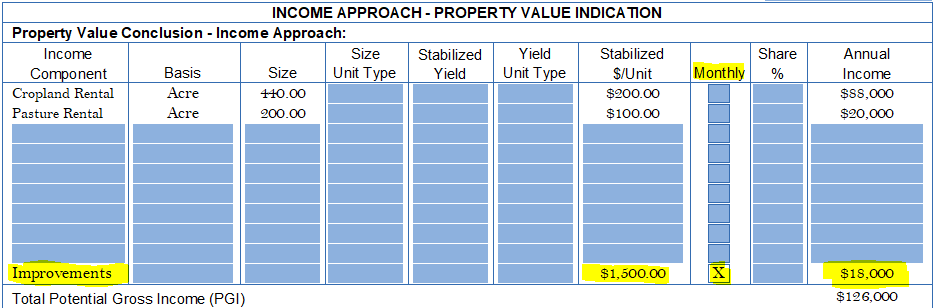
There is a second income page (appraiser's choice). It is located in the UCAF or Canada form sets in the Library (Form #1534: Enter "@1534" in the Library Search box). The filled out example below includes monthly improvement rental added monthly demonstrates this alternative. Its the same information, just displayed differently.
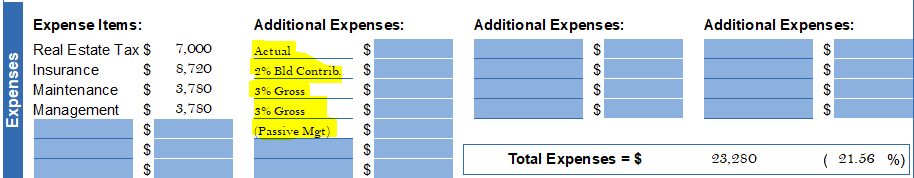
The “Allocate Expenses” box (red arrow below) list expenses like insurance, maintenance, management costs, and taxes. This option performs the mathematical calculations if taxes are entered as $/acre, or the insurance (% of contribution), or percentage for maintenance and maintenance (% of Gross Income). Once the net income for each sale is entered (“actual” or “estimated”), it is divided by the sale price to develop an overall capitalization rate for the income approach.
ClickForms (Steps 3-6) Creating an Appraisal Report
3. Choosing a Report Template
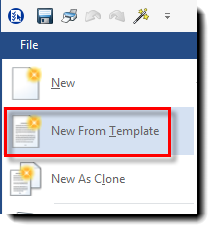
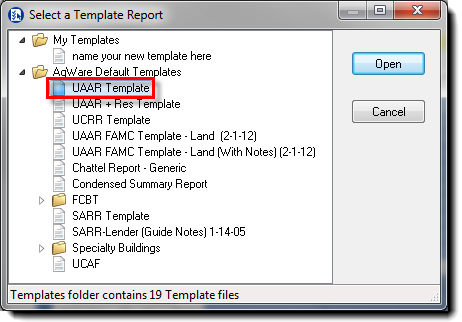
With ClickForms open, click the eagle head button in the upper left corner and click New From Template. A commonly used report template is the UAAR Template.
Delete any unwanted pages from the report by using the red X button on the Forms Manager tool bar. Many appraisers eventually create custom templates.
4. Input Subject Data on the Quick Start Page
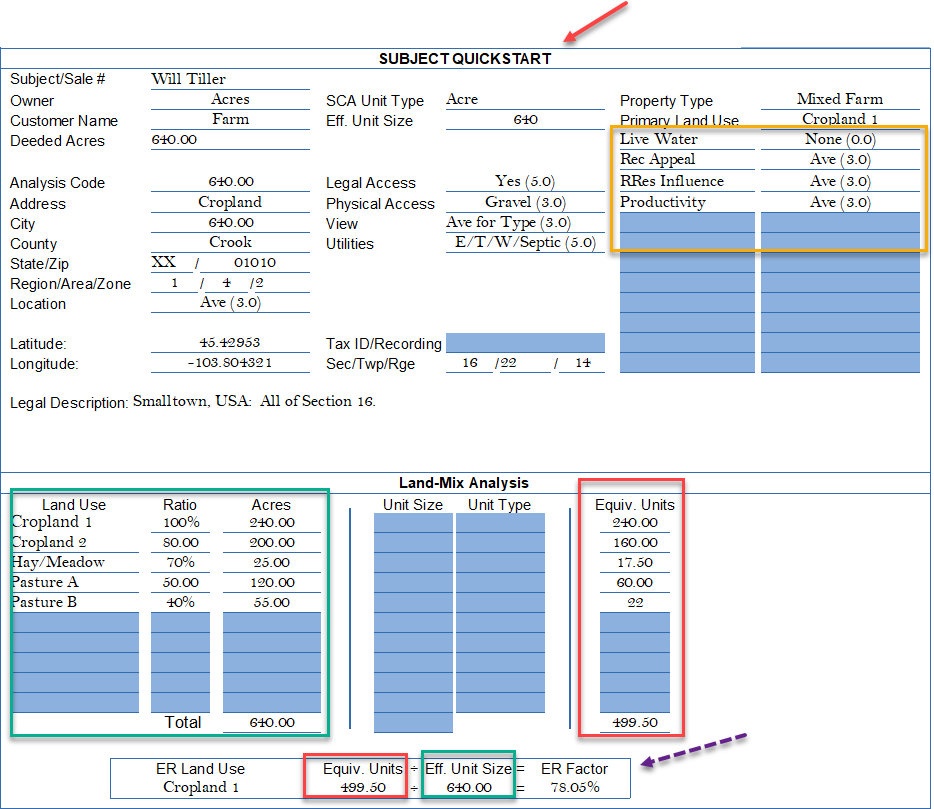
AgWare recommends the new "Subject QuickStart" page (red arrow) should be the first form in any AgWare ClickForm's appraisal. Although this page is not typically included as part of a delivered/submitted report, it serves as a platform for shared subject data in the appraiser’s digital/computer original report. The newest feature is the "save sale as subject" or "save subject as sale" function (that's why this new page looks like sales in DataLog). Also, most cells on this platform are linked to another pages in the report. Enter the subject information and be sure to include critical information necessary for ClickForms calculations to work; data such as:
- SCA Units
- Land Table and Subject's Ratios (The new ER land mix adjustment process requires Subject Ratios [purple arrow below])
Also indicate SCA Unit Type and effective size on this page because they transfer to multiple locations from the approach pages, the classic adjustment pages, and reconciliation page. Usually, the effective unit size matches the Subject's Total Deeded Acres. As noted previously, the unit type is most often but not always acres. The center fixed fields and variable fields in yellow should match all sales in DataLog used in the Cost and Sales Comparison Approaches.
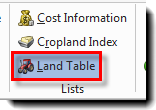
To import a Land Table for the subject, recall that you created a land list in DataLog. These automatically migrate into ClickFORMS. With your report open, click the Land Table option from the Lists group on the Home tab of the ribbon. Click the drop-down arrow to view a list of the tables. Choose the one you need and select "Transfer". The table will drop into the Subject Land Types section of the Quick Start page and into some other pages also. The order, land type spelling, variable fields, etc., must be alike for the program and pages to work in synchronization.
The second page of the Subject QuiskStart is shown in two segments below. The yellow box items are all manual entry.
.The gross income and expense information is then added (yellow boxes) by first identifying the "income basis" (cash, share, or owner/operator [green arrow]), and the net income (red arrow) computed at the bottom of this section.
5. Import Sales into Report
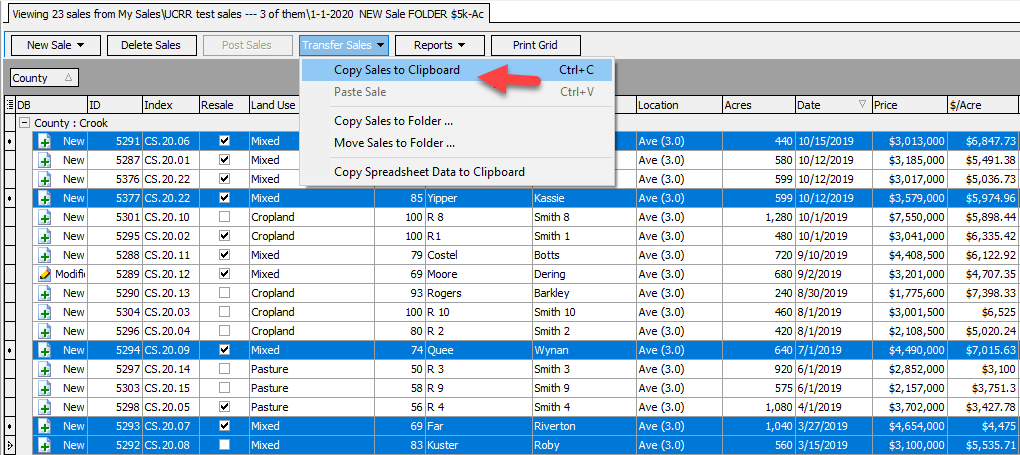
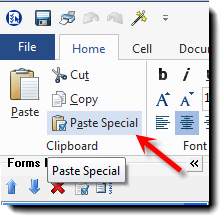
In DataLog select the desired sale/s (5 improved sales used in the Sales Comparison Approach shown below) and click Transfer Sale → Copy Sales to Clipboard (red arrow). Switch back to the report in ClickForms, click Paste Special under the "File" tab (second image below).
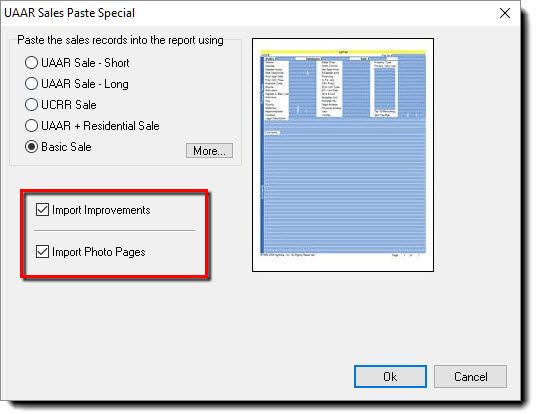
If you want improvements and photo pages from sale attached from DataLog, be sure the ClickForm boxes are ALSO checked as shown in the red box below.
Any time you paste/paste special a sale, it drops in at the bottom of the Forms Manager list in ClickForms. ClickForms recognizes that there some sales in the report, but it does not know which sale is which. Furthermore, the sales’ data have not yet been transferred into the approach pages in the report. So first
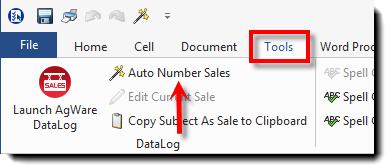
- rearrange the sales pages in the list using the "up/down arrows" at the top of the list, or use the "drag/drop" method, to put them in the preferred order (usually the order depends on whether the Cost or Sales Comparison Approach is first in the report (Say, Cost --- then put them first; then SCA --- putting them second). To quickly renumber them now that they are in order, click the Auto Number Sales option on the "Tools" tab.
Doing this enables the reader/appraiser to easily identify the sales used in the approaches because they will be labeled the same way in the Table of Contents and the Forms Manager.
This is also how ClickForms knows which sale is which! NOTE: assigning numbers to sales pages this way in a report changes NOTHING about the sales from, or in DataLog.
The upper part of a sale sheet is shown after the "AUTO NUMBER SALES" used and displaying:

- purple box = index number the user creates for this sale record in DataLog (your creativity can be applied to this number, but remember if the "i" number is used to pull in the sale from DataLog that the resulting impact on its width with the grids, i.e., the longer the enter is --- the more difficult for your reader because the font will be automatically reduced to accommodate the space within each cell
- green box = the number specifically assigned by the computer in DataLog to tell one sale from another. The "issue" this solves is what happens if the user assigns 1007 to a sale, then accidentally does it again for a different sale? The point is the computer assigns the next available record sequentially, so no record can have a duplicate record.
- red box = the result of the "AUTO NUMBER SALES" is #1 is assigned to the first sale at the top of the list in the report. That or those sale records can come at any point within the report, but the first sale is assigned #1, then #2, and so on. Then the user can use those "single digit" or smaller sale numbers to put the information into the respective grids in all three (3) approaches.
The appraiser could manually insert this number on each sale sheet separately, but the Auto Number button is a one-click effort once the sales are pulled into the report, then sequenced.
The sales need their new (internal) report numbers prior to step 6!
6. Transfer Sale(s) Data into Approach Pages
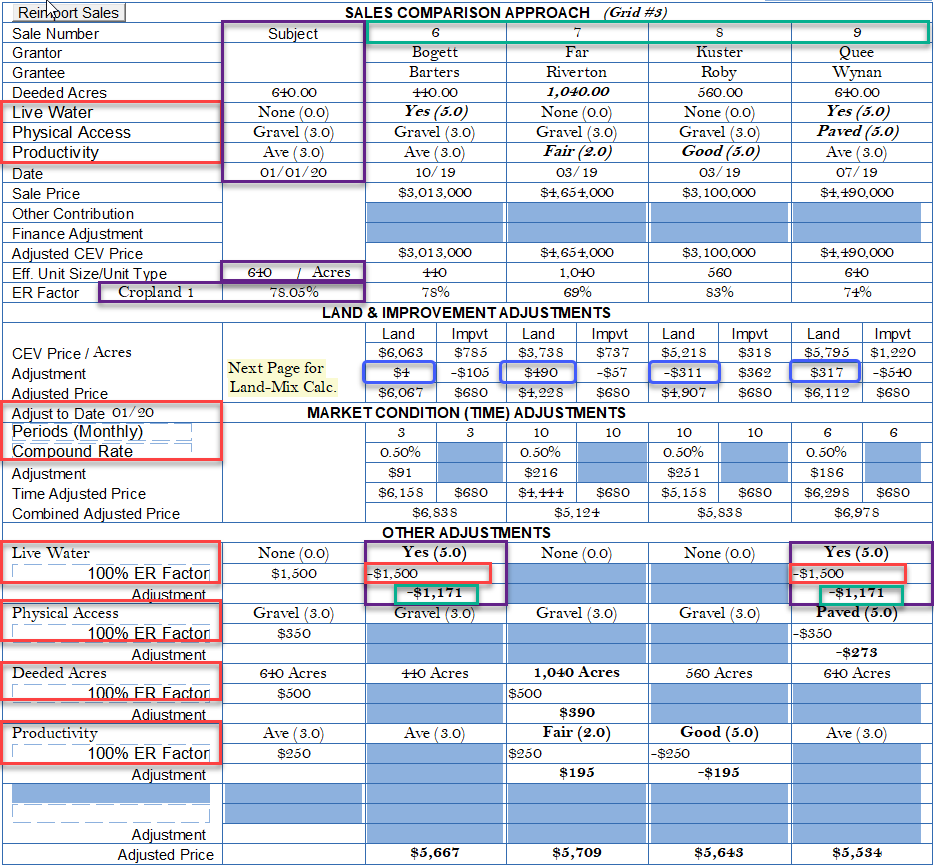
For approach pages such as the Sales Comparison Approach shown above, The "Subject" information (upper purple boxes) will pull from the Subject QuickStart page. The enter the red boxes along the entire left side of the grid. The Live Water, Physical Access, and Productivity all sync with the sales selected in DataLog. These are "type ahead" fields, if the exist in DataLog.
- For the "Classic" method (land-mix procedures prior to 2020), "Sales Adjustment" pages are unique to each sale and they must be included in the report in order for calculations to work properly. Once the sales are transferred into the approach page, the adjustment pages will automatically update the Land Adjustment portion. The appraiser must manually enter some data for the Improvement Adjustment portion for improved sales.
- For the new "ER" method, the land-mix adjustment is a "one-line" or single calculation illustrated by the "blue oval" across the Grid in the "LAND & IMPROVEMENT ADJUSTMENTS" section based on the percent change (not percent difference) between the Sale's ER versus the Subject's ER Factors.
Enter the sale number (upper green box) in the desired data column and press the enter key. The corresponding sale’s data automatically migrate into the approach page. In other words, you are “informing” the software that the data for Sale #1 should be transferred into the approach page(s) as Sale #1 into whichever column you want. The typical assumption is that if you labeled a sale record as Sale #1, you want its data placed in the first column. An obvious exception is when there are more than 5 different sales to be used for multiple approaches. So sales #6-8 for example, might be in the 1st-3rd columns on the Cost Approach page, while sales #1-5 are used only for the Sales Comparison Approach.
Then enter the "Adjust to Date", "Time Adjustment Periods (monthly or annual), then method of time computation (compound or simple). When the sales are selected the periods will be automatically computed. Then progress down the grid to "OTHER ADJUSTMENTS", or the elements the user desires to rate and/or adjust for by comparison to the subject. NOTE: each 3-line block consists of:
- Element or Feature
- Adjustment Basis (100% ER Factor, Percentage, or Qualitative". This automatically:
- 100% ER Factor is selected when pairings are completed using the new "pairing" pages (multiple or single feature) where the 100% land was used as the basis. This option should not be selected if the user is not using ratios to analyze their data in DataLog. If the 100% ER Factor is selected, enter the 100% measurement on the middle line of the 3-line segment. The program automatically computes the correct ER amount by multiplying the 100% Factor by the SUBJECT ER rating, or 78.05% in this example --- which then shows the corrected land-mix calibrated adjustment at -$1,171/acre for the subject's mix.
- Percent Adjustment: enter the percentage found through the pairing process, enter that percentage for each sale in the middle line (small red boxes), and the ClickForms automatically computes the adjustment in the small green boxes where needed.
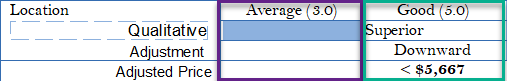
- Qualitative: Enter the "sale's" ranking either superior (purple box below), inferior, or equal on the middle portion of the 3-line adjustment block. Then on the third line (green box) enter the DIRECTION of the adjustment, i.e., downward, upward, or leave "no adjustment" blank or say "equal". Recommendation: when using the "Qualitative" procedure, use the "<", ">" or "=" signs for the final direction the sale suggests where the subject's value is being bracketed. See next graphic below for this third option.
- Numeric Adjustment actually applied in the grid.
Complete the approach pages, write the comments, do the summary and reconciliation, etc.
7. Finalize the Report
- Complete the finishing touches for the report. Add maps, documents, etc. (details in the User Manual).
- Check the page order, print quality, numbering, etc.
- Affix a digital signature if desired.
- Be sure to save the report with a meaningful and concise file name: Apples to Oranges – 2015 for example, with seller to buyer last names and year completed.
- Best practice is to omit using punctuation marks for file names; hyphens are OK.
- Print, create a PDF, or email the completed report. Congratulations!