Non Head-to-Head Adjustment SCA Grid
![]()
Head-to-Head
Versus
Non-Head-to-Head Building Adjustment
The procedures are markedly different, and the improvement adjustments react differently within the new ER Sales Comparison Approach (SCA) grid due to what they each include.
- The traditional Head-to-Head process derives a “sale-specific” improvement adjustment at the sale’s transaction date (Source: ASFMRA courses beginning circa 1980’s). For example:
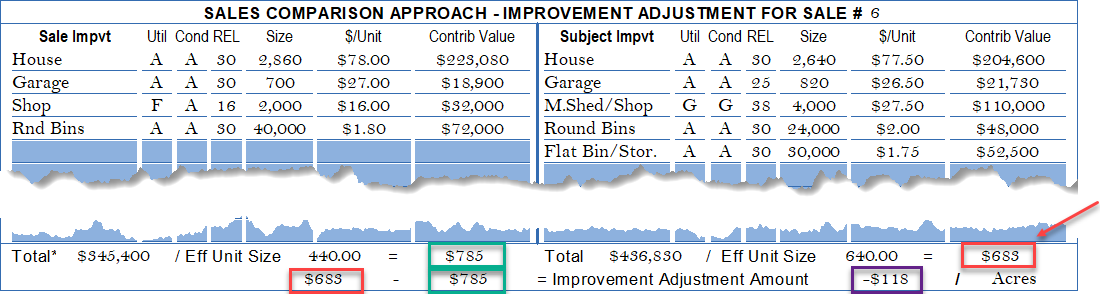
The sale improvements (left) were allocated at $785/acre (green), all selling as a group on the same date. The subject’s improvements (right) are valued at $683/Unit (red). The -$118/Unit difference (purple) represents a combined adjustment of the total building group. That difference can be time-adjusted to the subject’s date of value with one market-defined rate because all improvements move at the same time together.
- The new Non-Head-to-Head building adjustment option (December 2020 AgWare release) requires clarification for use in the ER SCA Grid because the subject’s buildings are valued once from an array of sale contributions each occurring on a different date. For example, there may be four sales with houses or dwellings --- each several months or years apart. Adjusting each structure to the subject’s date would require multiple time adjustments, which may be a different adjustment depending in which month or year they occurred.
Further, the second building type (machine shed/shop) appears in five sales --- all taking place at differing times. Each building of the same type would be time-adjusted from its sale date to the subject’s date of value. Again, multiple time adjustments would be necessitated depending on the month or year they occurred --- a situation that may not be supportable from your data.
The new procedure is a simple presentation of data to solve the subject’s building valuation problem --- usually for situations with limited sales of the subject’s type. The sale improvement contributions are grouped by structure after hitting the “Import Sales” (purple) button. There are four sale houses highlighted (yellow) in this example that vary from $31.25 to $90.00/Unit. The final column qualitatively describes how each sale home compares to the subject. Sale 2 is slightly superior at $82.88/Unit. From that benchmark, the user should select a “qualified” level of contribution for that improvement based on:
- effective age (includes all forms of depreciation, i.e., physical, functional and external),
- condition,
- and the date of value for the subject (building into conclusion the impact of time from the sale date the building occurred to the subject’s valuation date, including changes in physical depreciation during the interim).
The latter assumption or by selecting a $/Unit reflecting the impact of time avoids multiple time-adjustments to each subject’s building originating from sales across differing month or years.
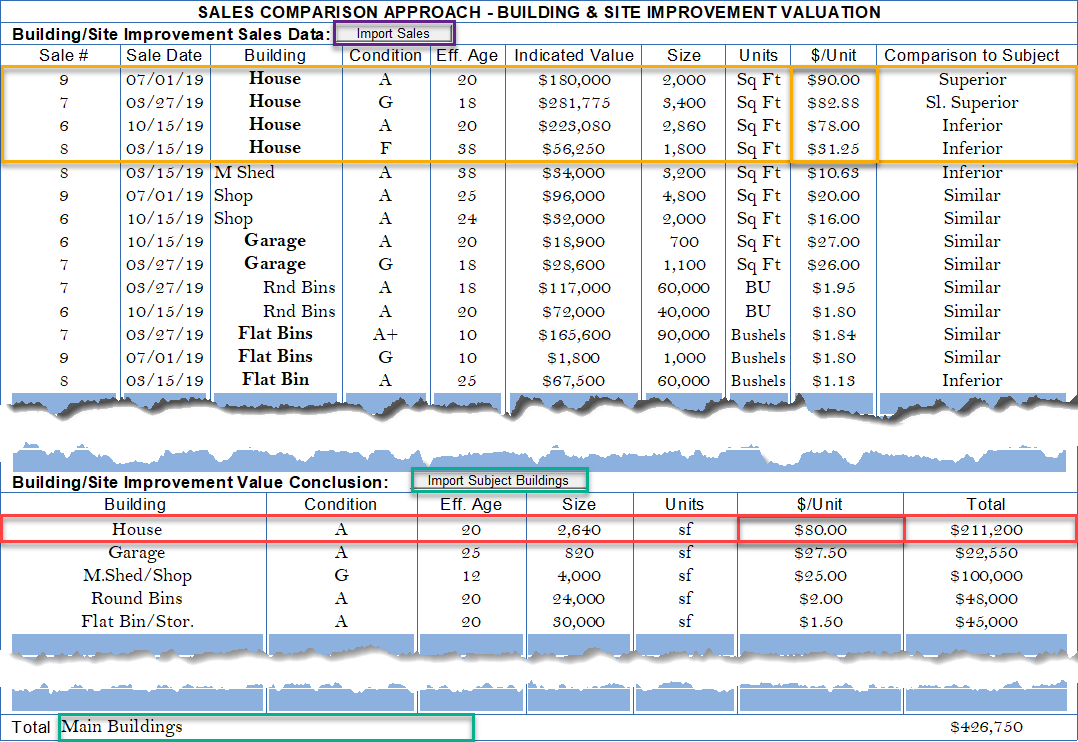
After hitting the “Importing Subject Buildings” (green box), the buildings, sizes, effective age, and SCA unit are shown. The “subject house” (red box) is reconciled at $80.00/Unit must correspond to the three elements, the las of which is the subject’s date of value. Because $80.00/Unit is not specific to any one sale or sale date, AgWare has no easy way to quantify the impact of time for a single building within a group of structures without the user taking it into account at the final selection.
As stated before, the problem magnifies because each of the subject’s five buildings may reference a different sale. Hence, time-adjustments as a “combined group” are NOT allowed because they were reasoned and selected “as if” they are current. ClickForms will show a “Mis-Match” notification if the user attempts to insert a time adjustment to the building cell when this 2-page form-set is used to potential avoid double accounting (see blank cells on the last page of this explanation).
The lower green box on the second page of this form-set is a summary of the first, but that first page can be entered multiple times. Each time page one is included, there should be a corresponding “label” for that set of improvements like the example below shows, e.g., grain facility, feedlot, etc.
or building group name is transferred to the second page along with the one-time subject building valuation total (lower right corner of the page).
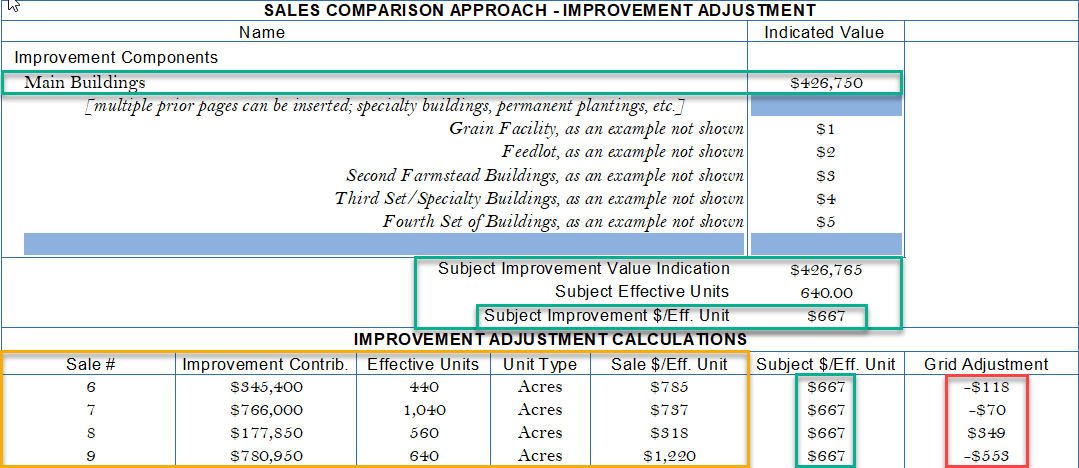
The upper green box denotes “Main Buildings” that were transferred from the bottom of the prior page with a contribution of $426,750. Multiple building sets, some could be in other locations within the total subject ownership, can be identified individually. NOTE: The $15 summed from the additional examples artificially inflates the total contribution to $426,765 but is not significant enough to change the final $667/Unit indication ($426,765 ÷ 640 Units = $667/Unit total contribution).
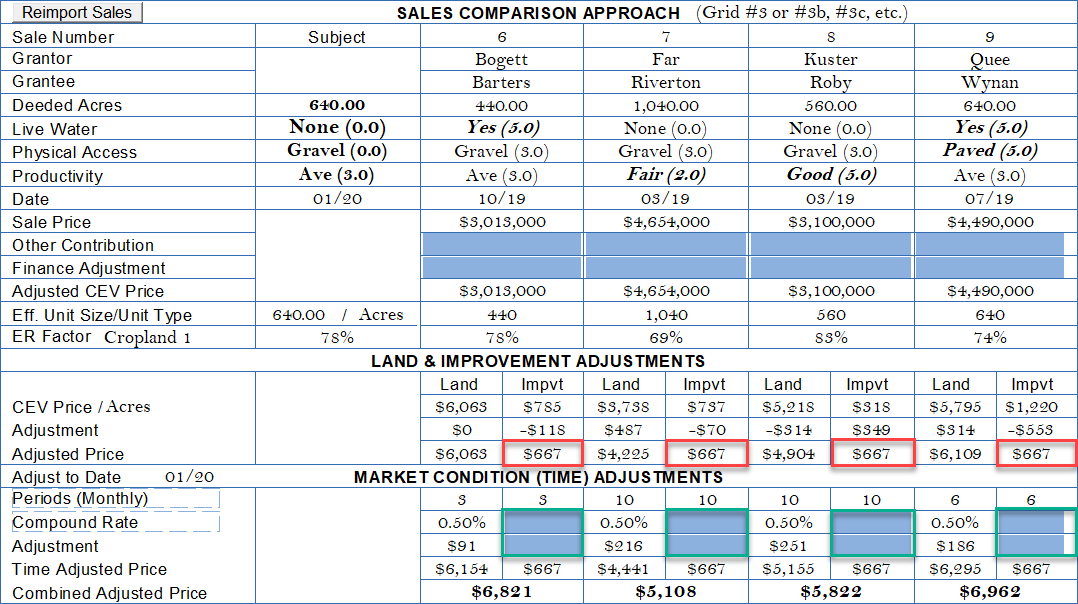
The improvement contribution for the sales identified in the middle of the sales comparison grid below and automatically populate the lower grid. Each sale’s improvement adjustment is calculated as:
- $/Unit for Sale X’s Building Contribution ($785 for Sale 6)
- -$667/Unit Subject’s Building Contribution
- =$YYY.YY Adjustment (-$118 for Sale 6)
Hence, the “adjusted price” at the bottom of the “Land & Improvement Adjustments” is always $667/Unit ---- in this example (red boxes below).