Condensed Summary Report: FCS Cost & Sales Comparison
![]()
CONDENSED SUMMARY REPORT: FCS COST & SALES COMPARISON
This Farm Credit 4-page appraisal can also be used by other users if desired. The “set” consists of:
- Report Summary (subject identification consisting of land and buildings, if any)
- Forms Library→Condensed Summary→FCS Report Summary
- Sales Comparison (blended $/Acre for both land and buildings)
- Forms Library→Condensed Summary→FCS Report Summary
- Cost Approach (blended $/acre for both land and buildings)
- Forms Library→Condensed Summary→FCS Cost Approach
- Reconciliation Worksheet
- Forms Library→Condensed Summary→FCS Reconciliation Worksheet
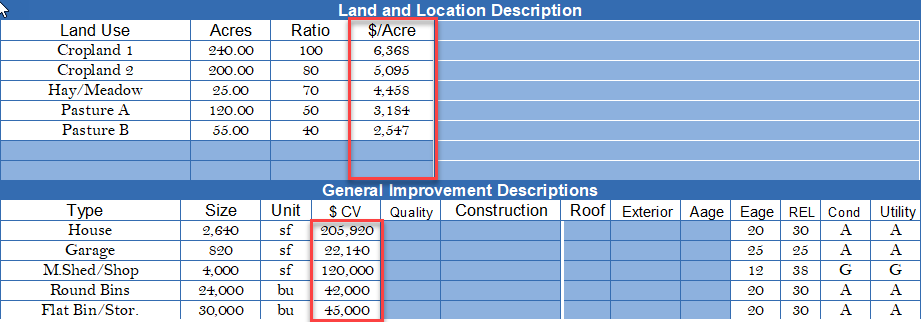
Either the cost or sales comparison approaches can be omitted, depending on the data available. The upper portion of the Report Summary is not shown below; the graphic includes the second, third, and fourth blocks of that page:

The most important subject information pertaining to the land and buildings are shown. The $/Acre is note shown (right of red outline) because that transfers back onto this page from the final Reconciliation Worksheet (fourth page in this group), i.e., the $/Acre “auto-fills” from the “Reconciliation” — not manual entry.
Again, only the relevant improvement information is shown. Additional entries should be made by the user for quality, construction, roof, exterior, and “Aage” (Actual Age), if desired. “Eage” is an abbreviation for effective age; and “REL” is remaining economic life — likely the most important approximation for the structures.
Sales Comparison Approach
Initially, this form seems daunting at first glance before it is filled. A sample is provided:

Subject (green) populated from the “Report Summary” or can be entered manually. The sales can be called in:
- directly from DataLog (red box) using “d-numbers”, e.g., numbers automatically assigned by the program and specific to each sale
- directly from DataLog using “i-numbers” for each sale (upper left corner of sale record) the user manually enters upon starting sale documentation, or
- as shown above, pull sales from DataLog into the Clickforms container (the demonstration appraisal in AgWare’s documentation examples); then using the “tool” tab and “auto-number sales” function which assigns numeric numbers sequentially to each, or you can manually number the sales in the manner desired.

Again, the subject is identified in green (leave solid green fields blank — they will be transferred back from the bottom of the page !!!). The first improved sale (Sale 3) is shown in red. The allocated prices for each land type are displayed, then adjusted for land-mix, improvements (buildings adjusted for difference between the sale structures and subject buildings at bottom of page); then, compound time adjustment, and “other” factors shown as “live water”, “physical access”, and “size” for this example. Note, only three (3) variable elements are possible within this form. At the bottom of this “block”, each sale provides a separate indication of the subject’s land value after adjustments.

Formatting was added to obtain visual separation from the original spreadsheet-like format. Users should craft their own view to assist the reader.
Most of the subject’s information transfers from the “Report Summary” page. The exceptions are the small green boxes, which represents the appraiser’s conclusions from viewing the sale improvements structure by structure — then opining to each corresponding subject building using the “quality” and “condition” abbreviations. Simply, the subject’s house is A/A; while Sale 6 (red box) has a G/A house, or slightly superior. Thus, some conclusion less than $82.88/sf (small red box) is suggested for the subject’s house. The three (3) houses shown for the remaining sales are an extension of that initial reasoning, i.e., the “bracketing” continues until the appraiser has sufficient basis to form a final opinion about the subject’s house — ultimately at $78.00/sf. Each user might opine a slightly different conclusion, but that is expected given the imperfections in the market and the “analysis procedure” applied (building residual for all sales — after land).
This process is applied for each subject building, i.e., garage, machine shed/shop, round bins, and flat bin/storage building. From the land and buildings indications from each sale (yellow box), the appraiser selects the value most representative of the subject’s value via this approach.
The final value is calculated at $5,650/acre X 640 acres = $3,616,000 (rounded); then allocated between land and buildings ($435,000 for buildings leaving $3,181,000 for land in this example). It is critical to understand, the land at $3,181,000 is used to transfer back up into the upper grid for the “price distribution” for the subject’s land. If the user fills the form from the “top” down, the first thought is how can you conclude the subject’s land value without seeing the sale indications. One doesn’t, i.e., the answer stems from conclusion at the bottom which is transferred. See next page.
The design is a “clock-wise” beginning with the small green arrow and $3,616,000 conclusion back around to ultimately provide the subject answers in the green and small red boxes.

Cost Approach (FCA Form-Set)
The top of the Cost Approach pulls from the “d” or “I” numbers, or from sales populating ClickForms. Again, the subject’s value cannot be opined from merely entering the sales; thus, the solid green box is NOT a manual user entry.
ASFMRA education stresses valuing each land type, i.e., Cropland 1, Cropland 2, etc. individually; however, this grid again calculates the blended $/Acre for the land portion like the Sales Comparison approach at $5,000/Acre or $3,200,000 for this 640-acre subject.

The next image, “back-fills” the solid green box; then moves to the building contribution portion.

The buildings are summed (purple box) to $439,695 illustrated on the lower left corner (calculation not shown); then added to the $3,200,000 land estimate (small red box) for the final opinion of $3,640,000 (rounded in yellow box).
Reconciliation Worksheet
This page is “auto-filled” from the approach pages. The intent of the Reconciliation Worksheet is a side-by-side summary of each approach. “ROV” or range of value has not been used in this example; and would generally replace the cost and sales comparison approach(es) —or both.
The Sales Comparison indications (yellow) have been selected because valuing a “mixed” property with more than land type is best measured sales with commensurate mixtures.

The subject buildings (purple) are based on the Sales contribution’. ASFMRA recommends either using Sales Comparison or the Cost Approach for both land and buildings; not mixing indications from both, i.e., sales comparison land plus buildings from the cost.
The “calculated weighted REL” or remaining economic life (manual entry), is directed to the mortgagor (FCS) as a benchmark for loan security, i.e., the building’s life at 32 years (small purple box(es) should be longer than the loan term.
The red boxes are the user’s reconciled value opinion and state the reported value(s). The conclusions are automatically transferred back to the first page “Report Summary” (shown below (red)).